

Device page
How to read a device's detail page: index, consumption, alarms and history.
Device page
Every device supervised by Drexo has its own detail page at
/<organisation>/devices/<id>. The page adapts automatically to the device
type: an Itron water meter doesn't show the same blocks as a
pool sensor or a connected TV.
This guide covers the water meter page (type: water_meter),
the most common type today, then the page of a
Shelly smart socket.
How to reach it
Three paths to the page:
- From the left rail: expand your organisation, then a zone, then click the meter's name.
- From Shared with me: click the card or the device name.
- From a dashboard: click any device widget to land on its full page.
The URL accepts a time-window parameter:
?range=1: last 24 h?range=7: last 7 days (default)?range=30: last 30 days?range=90: last 90 days
What the page shows
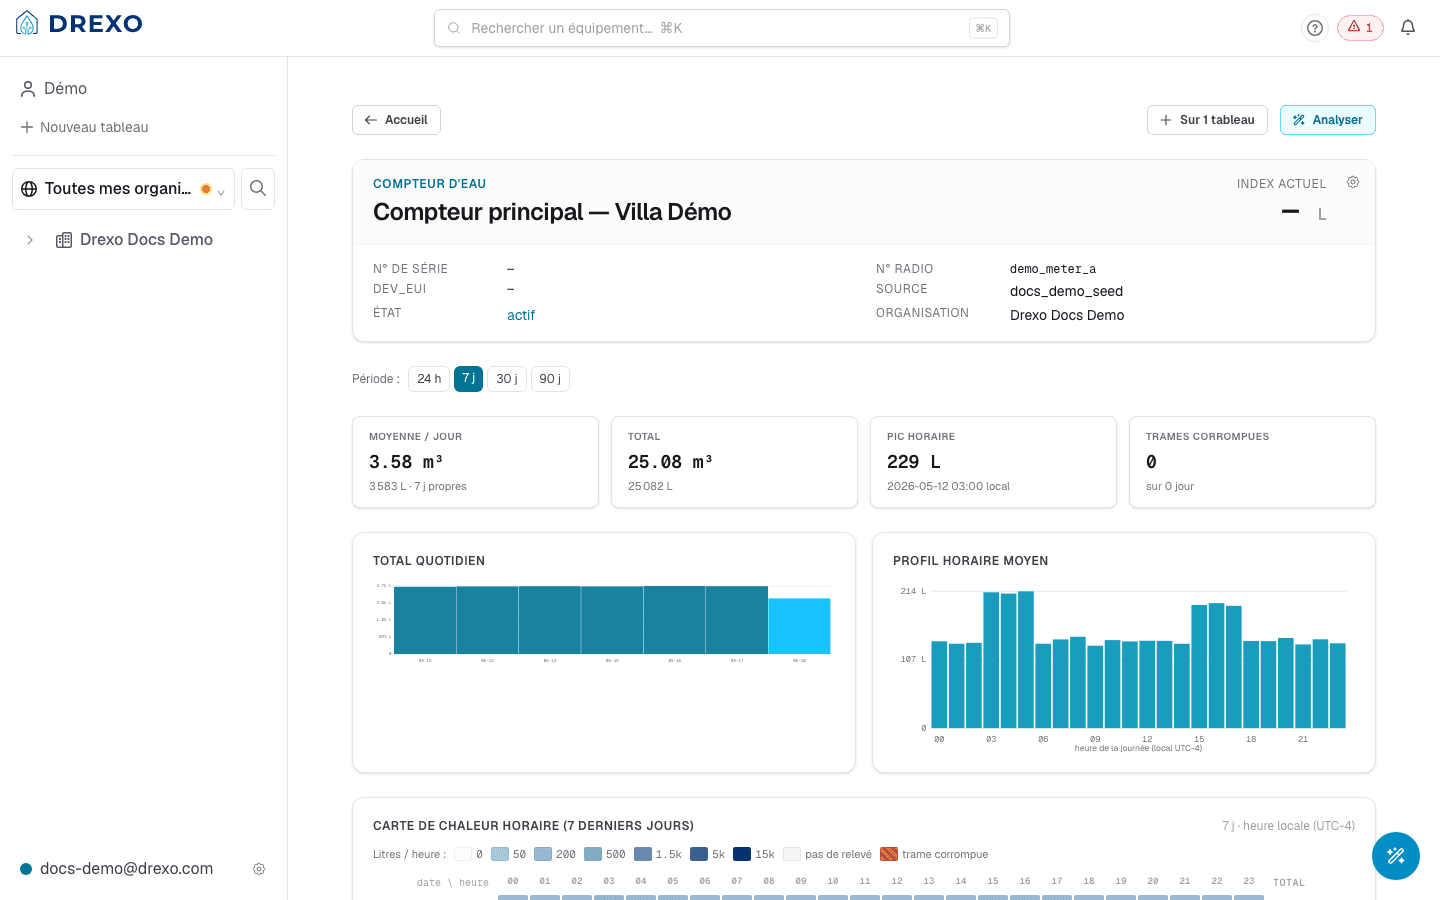
1. Header
- Device serial number + internal name.
- A decoder badge naming the meter family (e.g. Itron Intelis wSource).
- Alarm chips for every currently-raised alarm.
- Three actions on the right:
- Pin / Unpin from a personal dashboard.
- Rename for my organisation: alias shared by every member of your organisation.
- Rename for me: strictly personal alias, invisible to other users.
The organisation nickname, tags, zone placement and dashboard pinning can also be edited straight in the grid of the Data surface. The grid and the device page write to the same place: a change made on one side shows up on the other.
On a Map or 3D Map view of the Data surface, the organization owner can also move the device's registry position directly on the map. A device whose displayed position comes from its own telemetry (fresher than the registry) stays readable but cannot be moved.
2. Stats strip
Four key figures across the chosen time window:
- Average per day: total consumption ÷ number of days.
- Total over the window.
- Hourly peak: the biggest single-hour consumption observed.
- Corrupt frames: count of frames received but undecodable. A healthy meter stays at zero; a rising value signals a reception or hardware issue.
3. Side-by-side charts
- Daily total: bars; one day = one bar. Quick read of high / low days.
- Hour-of-day profile: average per 0–23 h slot. Surfaces habits (morning peak, night trough, continuous 24/7 leak, etc.).
4. Hourly heatmap
A days × 24 hours grid where colour encodes the amount consumed per cell. Effective for:
- spotting a leak (non-black tint every night for hours);
- spotting a one-off anomaly (a dark cell isolated at 3 AM);
- seeing weekends and holidays at a glance.
5. Alarms
- Active alarms listed on top, with raised-at timestamps.
- History of resolved alarms below (last 100 by default).
See Alarms for the full list of alarm types and their severity.
6. Recent volume-index readings
Table of the raw readings the meter has reported, time-stamped. Useful for operators who need the exact value the device returned before any Drexo computation.
The page of a Shelly smart socket
A Shelly smart socket (type: shelly) has its own page. It is deliberately
minimal for now: it confirms that measurements arrive and shows the last 24
hours of consumption, with no time-window picker.
What the page shows
The page fits in one card:
- At the top, the socket's name, then its live power: what the socket
draws at the time of the measurement, in the unit it was sent in (
W, watts). Hover the value, reach it with the keyboard or tap it to see the time of the measurement, in UTC, as announced by the box that reads the socket. The name sits on the left, the value on the right. - Below the line, the Consommation totale (total consumption)
section and its hour-by-hour chart. The section's i button gives the chart's
scale (unit, highest bar) and the socket's own counter as it was sent (
W.h, watt hours), with the time of that reading. Drexo does not recompute the counter.
The four states
When all is well, the card shows no state. Otherwise a label sitting on the card's top-right corner says it in words, in its own colour:
- Up to date (nothing shown): the latest measurement reached Drexo less than two minutes ago, which is four readings of the socket.
- Ancienne (old, slate-violet label): the latest measurement arrived longer ago than that. The value stays on screen, but it no longer says what the socket draws now. Age is judged on the time the measurement reached Drexo, not on the time announced by the box, whose clock can drift.
- Aucune mesure (no measurement, amber label): nothing has arrived for this socket, and a sentence under the name says so. When it has been registered for more than 30 days, the page only says that no measurement has arrived for at least 30 days: Drexo does not look further back.
- Lecture impossible (reading failed, rose label): Drexo could not read the measurements. This is not a silent socket: the page shows no value at all, never a zero, and the chart's place shows a grey shape with no values and a soft shimmer (still if you reduce motion), under the sentence that explains it. If only the history could not be read, the value stays and only the chart's place changes.
The state is computed when the page opens: reload it to refresh. Only people with access to the socket see its page and its measurements.
Consumption hour by hour
In the total consumption section, a chart shows what the socket consumed during each of
the last 24 hours, up to the current hour, in kW.h. Each bar is the
difference between the last counter reading in that hour and the last one
in the hour before. Hours are the ones the box announces for each
measurement, in UTC, not the time the measurement reached Drexo.
Hover an hour, reach it with the keyboard or tap it to read its value, its unit and the time of its last reading. The i button right of the title shows the legend; tap it again, or press Escape, to close it. The chart keeps apart what a plain chart would blur together:
- A bar: the hour's consumption. Every bar is drawn the same way.
- Nothing at all: the hour was measured, and the socket consumed nothing.
- A dashed frame, marked "en cours" under the axis: the current hour. It is not over yet, and its value will still grow.
- A small grey cross, no bar: no usable measurement for the hour. That is the case when no measurement arrived, for example because the link dropped; for the hour after a gap, whose difference spans the whole gap; and when the socket's counter started again from zero, which makes the difference negative. None of these hours is shown as a zero.
If the box changes unit within the period (W.h, then kW.h), each unit is
converted before being added up, and the first hour in the new unit is not
drawn. A unit that does not convert to energy is reported and the chart is
not drawn.
Allow a day of the box running to see all 24 bars: a socket plugged in this morning only has the hours since then. The chart is computed when the page opens, like the state.
Ask the assistant
The Ask AI button at the top right opens the chat with the device's context pre-loaded. You can ask things like:
- "What's the average daily consumption over the last 7 days?"
- "Did any alarm fire last night?"
- "Does the hour-of-day profile suggest a leak?"
The assistant never makes up numbers: it calls the same data sources the page itself uses, and cites the public documentation when you ask about how the platform works.
Sharing the device
If you own the organisation the device belongs to, a Share button appears in the header. See Sharing for the options (personal, organisation, public link).
Otherwise, when you receive a share, you can:
- open the page to consult the data,
- optionally place the device in a zone of your own organisation (when the granter allows it),
- or leave the personal share (Leave share button at the bottom of the page), which revokes your access.